The FBI released crime data for all of 2016. Just like Chicago, violent crime continued to trend upward nationwide for the year.
And just like Chicago, one must assume the catalyst for the nationwide increase is the false narrative of Black Lives Matter and similar anti-police groups. Next up, we will attempt to take a look at racial make up of victims/assailants and look at police involved shootings in Chicago the same way Heather Mac Donald did here in her recent article.
28 Fewer Wards - Sept 26, 2017
The city of Chicago publishes CompStat data for each district (example here), and these weekly reports compare crime statistics, typically violent crimes that concern most citizens like burglary, robbery, criminal trespass and more. From the reports command staff can measure how the districts are performing. If the district is not showing improvement, the district has to answer for this, and that's when additional pressure on officers for improvement follows (aka quotas). These CompStat reports are also available to anyone in the community paying attention. They are usually shared at neighborhood CAPS meetings.
By looking at crime by ward, aldermen could share in the responsibility of crime rates - it would no longer just be "the police's fault" if crime was on the rise.
 Data Source: City of Chicago
Taking this idea a step further, what if we could remap the ward boundaries to match the police district boundaries?
There are currently 22 police districts in the city of Chicago. We, citizens, could ask for a reduction in the total number of wards from 50 to 22. Because let's all be completely honest, does anyone really believe we need 50 aldermen to run the city?
This reduction would of course mean 28 aldermen would be out of jobs, but think of the savings. Chicago politicians are all about cutting out fat, like, for example, when they eliminated three police districts, and called it "efficiency" and a move to stop a "redundant administrative structure". By cutting out these aldermen's 27 salaries, Chicago could save 3.2 million dollars (based on an average of $118,000 salary per alderman, as of 2015).
Furthermore, there would be savings from fewer staffing needs at each ward. This would be another 4.2 million in tax dollars saved (at roughly $181,800 per ward). So almost 7.5 million in savings in salaries ALONE. This is just the beginning of where we could find precious dollars by efficiently reducing Chicago from 50 to 22 wards. Imagine a city with fewer wards and aldermen.
There are other benefits. For one, no more ridiculous ward mapping. On the left side of the image below is the current ward map of Chicago. On the right is the current police district map for all of Chicago.

Chicago residents would finally understand what ward they live in and what police district they live in - because we would combine the ward/district and they would be the same.
The best part is by having a ward and district combined, it would allow aldermen to take a more visible position of responsibility for Chicago's crime to properly take ownership of the city's violence. For example, if an angry citizen calls the police station and complains about crime, the caller could easily be passed to that same district's elected alderman, an official who actually participates in making policing policy changes.
Or when a citizen complains to officers about a 30 or 45 minute response time for a robbery or burglary, the officer can simply say, "I'm sorry we are in RAP status - we have been for days. We can't afford enough officers. Please call alderman x of our district, who is in charge of the city's budget and financial oversight."
Finally, as the crime continues unabated, and it becomes clear to everyone the Kim Foxx social justice experiment has failed - as it is so brilliantly doing before our eyes - police districts can simply direct the complaints to the district alderman, who, more than likely, blindly supported the election of Kim Foxx for Cook County States Attorney in the first place.
So here's a novel idea: What if Chicago published weekly CompStat data based on ward, not district. Like the following. Below are current year's incidents of crime (Homicide, Burglary, Robbery, Assault, Battery, Criminal Sexual Assault, Criminal Trespass, Theft, Weapons Violation) compared to the previous two years.
By looking at crime by ward, aldermen could share in the responsibility of crime rates - it would no longer just be "the police's fault" if crime was on the rise.
Taking this idea a step further, what if we could remap the ward boundaries to match the police district boundaries?
There are currently 22 police districts in the city of Chicago. We, citizens, could ask for a reduction in the total number of wards from 50 to 22. Because let's all be completely honest, does anyone really believe we need 50 aldermen to run the city?
This reduction would of course mean 28 aldermen would be out of jobs, but think of the savings. Chicago politicians are all about cutting out fat, like, for example, when they eliminated three police districts, and called it "efficiency" and a move to stop a "redundant administrative structure". By cutting out these aldermen's 27 salaries, Chicago could save 3.2 million dollars (based on an average of $118,000 salary per alderman, as of 2015).
Furthermore, there would be savings from fewer staffing needs at each ward. This would be another 4.2 million in tax dollars saved (at roughly $181,800 per ward). So almost 7.5 million in savings in salaries ALONE. This is just the beginning of where we could find precious dollars by efficiently reducing Chicago from 50 to 22 wards. Imagine a city with fewer wards and aldermen.
There are other benefits. For one, no more ridiculous ward mapping. On the left side of the image below is the current ward map of Chicago. On the right is the current police district map for all of Chicago.

Chicago residents would finally understand what ward they live in and what police district they live in - because we would combine the ward/district and they would be the same.
The best part is by having a ward and district combined, it would allow aldermen to take a more visible position of responsibility for Chicago's crime to properly take ownership of the city's violence. For example, if an angry citizen calls the police station and complains about crime, the caller could easily be passed to that same district's elected alderman, an official who actually participates in making policing policy changes.
Or when a citizen complains to officers about a 30 or 45 minute response time for a robbery or burglary, the officer can simply say, "I'm sorry we are in RAP status - we have been for days. We can't afford enough officers. Please call alderman x of our district, who is in charge of the city's budget and financial oversight."
Finally, as the crime continues unabated, and it becomes clear to everyone the Kim Foxx social justice experiment has failed - as it is so brilliantly doing before our eyes - police districts can simply direct the complaints to the district alderman, who, more than likely, blindly supported the election of Kim Foxx for Cook County States Attorney in the first place.
Reported Incidents of Violent Crime By District - Sept 24, 2017
Data includes all reported incidents of crime by district, Jan 1 to Sept 15, 2015 to 2017.
(For the purpose of this chart, "Violent Crimes" is Homicide, Burglary, Robbery, Assault, Battery, Criminal Sexual Assault, Criminal Trespass, Theft, Weapons Violation).
As you can see 14th District (Bucktown's Police District) has fared badly along with most police districts of the city. Crime has continued to increase over the last 2 years.
18th District has seen the greatest increase in crime compared to 2015. 16th District has seen the greatest decrease in crime.
Citywide (Grand Total), the entire city has seen an increase of over 9,000 more violent crimes than it did in 2015, an 8.2% increase.

Source: City of Chicago
19th District Arrest Map Sept 21, 2017
For our friends a little north and east of us.
We're working on putting all these on the side bar as links.
Until then, click on the map, zoom in and see an arrest for details.

If you're using a mobile device, arrest details appear in pop up window. All arrest details made available by Chicago Police Dept. Juvenile arrests not included.
We're working on putting all these on the side bar as links.
Until then, click on the map, zoom in and see an arrest for details.
If you're using a mobile device, arrest details appear in pop up window. All arrest details made available by Chicago Police Dept. Juvenile arrests not included.
14th District All Reported Incidents of Crime Jan 1 through Sept 12, 2017
Location of where all reported crimes the 14th district are located.

Zoom in and click on a event for more details.
Zoom in and click on a event for more details.
12th District Arrest Map - Sept 20, 2017
For our friends a little south of us.

Zoom in and click on an arrest for details. If you're using a mobile device, arrest details appear in pop up window. All arrest details made available by Chicago Police Dept. Juvenile arrests not included.
Zoom in and click on an arrest for details. If you're using a mobile device, arrest details appear in pop up window. All arrest details made available by Chicago Police Dept. Juvenile arrests not included.
"Bolstered by the knowledge police no longer chase" - Sept 19, 2017
We sat down with some folks and helped them with the numbers for this story.
Here are the latest numbers sorted by 2017 vs 2015. 14th district has seen a 725% increase in hijackings this YTD, 2nd only to the 1st district which has seen a 1,400% increase. Citywide there has been a 183% increase.

Here are the latest numbers sorted by 2017 vs 2015. 14th district has seen a 725% increase in hijackings this YTD, 2nd only to the 1st district which has seen a 1,400% increase. Citywide there has been a 183% increase.

We Need More Cops! - Sept 18, 2017
How many times have you heard it (and said it) before? Chuy Garcia ran on it. Last year Rahm Emmanuel finally agreed to it. And in a recent community meeting, at the beginning of this month, Captain Philip Kwasinkski of the 12th district publicly admitted he was short on "resources" (aka officers).
To be clear, the writers here support more officers on the street, but let's play devil's advocate for a moment.
Check out the image below. On the left are all reported incidents of robbery 2016 (Jan 1 to Sept 8). On the right are all reported incidents of robbery for 2017 (Jan 1 to Sept 8).

They look practically identical - that's because there has been no decrease in robberies 2017 YTD over last year. In 2016 through Sept 8, there were 7,809 reported robberies, in 2017 there have been 7,851 reported.
When we look at 2017 compared to 2015, we had over 1,680 more robberies this YTD. But how many officers do we have today compared to two years ago? Today Chicago employs 387 MORE officers than it did in 2015.
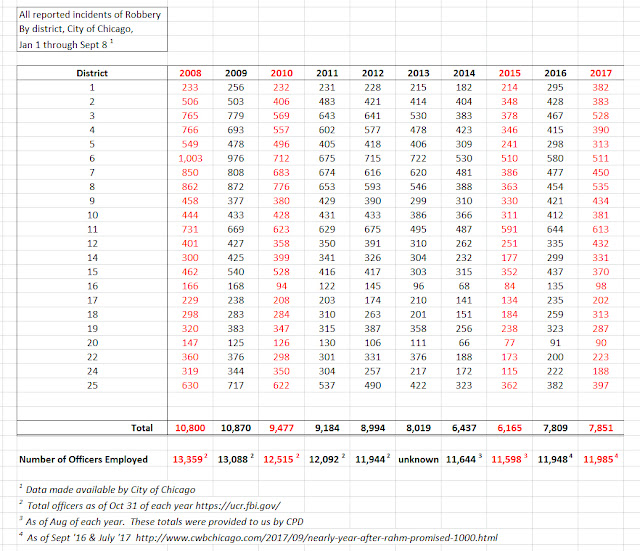
Let's go back even further: In 2010 Chicago had seen 9,477 robberies through Sept 8, that's 1,626 MORE robberies than we've seen today, and at that time we had 12,515 officers. So in 2010 we had 530 MORE officers than we have today.
Finally, take a look at 2008: In 2008, there were 10,800 robberies and 13,359 CPD officers. Compared to today, that's 2,949 MORE robberies and 1,374 MORE police officers.
So are more officers the answer? From this data, it seems to appear when there are more officers employed, MORE robberies occur!
Of course we don't believe that, but perhaps it's worth considering this: Even if somehow we manage to add 1,000 more police officers in the next 15 months, it may very well NOT result in a decrease in violent crimes, such as robbery.
This rallying cry, "More cops!" is almost like saying, "We need more doctors!" as a cure-all solution to the problems of the US healthcare system. Maybe the truth is we all need to brace ourselves and set our expectations low going forward.
Why say that? Look at these precipitators of crime (just a handful of many examples):
Why are there so few pointing out THESE as factors which contribute to Chicago's current increase in crime? One thing we can be sure of is these problems (unfortunately) will not go away even if we do hire 1,000 (or 2,000 or 3,000) more cops.
To be clear, the writers here support more officers on the street, but let's play devil's advocate for a moment.
Check out the image below. On the left are all reported incidents of robbery 2016 (Jan 1 to Sept 8). On the right are all reported incidents of robbery for 2017 (Jan 1 to Sept 8).

They look practically identical - that's because there has been no decrease in robberies 2017 YTD over last year. In 2016 through Sept 8, there were 7,809 reported robberies, in 2017 there have been 7,851 reported.
When we look at 2017 compared to 2015, we had over 1,680 more robberies this YTD. But how many officers do we have today compared to two years ago? Today Chicago employs 387 MORE officers than it did in 2015.

Let's go back even further: In 2010 Chicago had seen 9,477 robberies through Sept 8, that's 1,626 MORE robberies than we've seen today, and at that time we had 12,515 officers. So in 2010 we had 530 MORE officers than we have today.
Finally, take a look at 2008: In 2008, there were 10,800 robberies and 13,359 CPD officers. Compared to today, that's 2,949 MORE robberies and 1,374 MORE police officers.
So are more officers the answer? From this data, it seems to appear when there are more officers employed, MORE robberies occur!
Of course we don't believe that, but perhaps it's worth considering this: Even if somehow we manage to add 1,000 more police officers in the next 15 months, it may very well NOT result in a decrease in violent crimes, such as robbery.
This rallying cry, "More cops!" is almost like saying, "We need more doctors!" as a cure-all solution to the problems of the US healthcare system. Maybe the truth is we all need to brace ourselves and set our expectations low going forward.
Why say that? Look at these precipitators of crime (just a handful of many examples):
- Recent policy changes made from an agreement between the ACLU and the City of Chicago Police Dept
- The election of Cook County's top prosecutor who ran with one of her objectives to "being fair" to criminals and who overwhelmingly won the vote
- Politicians and others fanning the flames of the anti-police movement
- Black Lives Matter activists, like founder Alicia Garza, supporting the absurd notion we should abolish the police and that police are "systematically and intentionally" targeting people for demise solely for their skin color
Why are there so few pointing out THESE as factors which contribute to Chicago's current increase in crime? One thing we can be sure of is these problems (unfortunately) will not go away even if we do hire 1,000 (or 2,000 or 3,000) more cops.
14th District Arrest Map - Sept 11, 2017
Map showing all 14th district arrests by location. Jan 1 to Sept 11, 2017.

Zoom in and click on an arrest for details. If you're using a mobile device, arrest details appear in pop up window. All arrest details provided by Chicago Police Dept. Juvenile arrests not included.
Zoom in and click on an arrest for details. If you're using a mobile device, arrest details appear in pop up window. All arrest details provided by Chicago Police Dept. Juvenile arrests not included.
Subscribe to:
Posts (Atom)